See Rotations
Before They Happen
Quant 💯 Lens, Institutional-grade rotation intelligence meets quantum-inspired stock market analytics.
💡Know what's moving before it moves
Four Integrated Analytics Engines
Complete momentum market context in a single platform
Market Overview
Daily summary with multi-dimensional treemap visualization showing sector persistence and AI Powered Briefs.
- Sector persistence heat mapping
- Drill down to individual stocks
- Real-time score updates
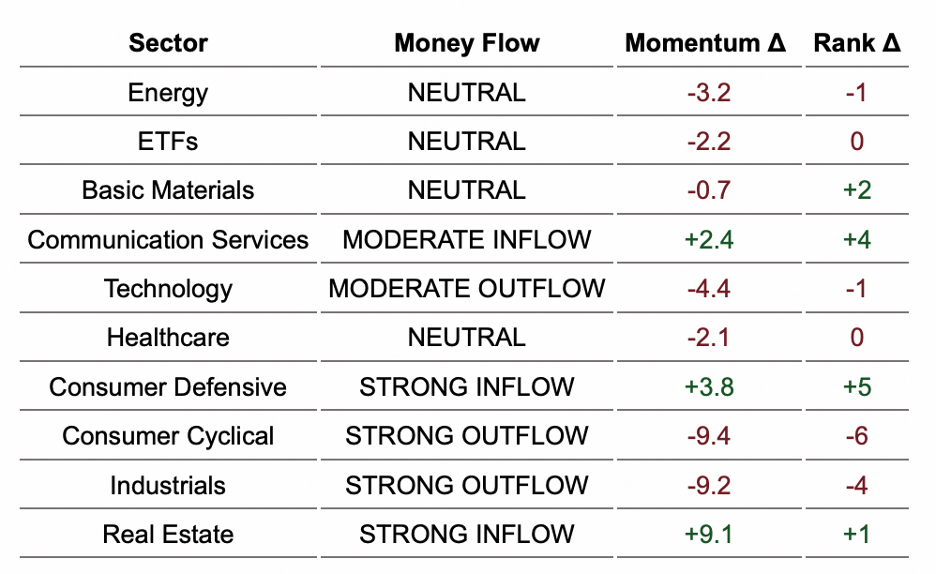
Rotation Signals
Early warning system for sector rotation with inflow/outflow detection and mean reversion analysis.
- STRONG INFLOW / OUTFLOW signals
- Z-score mean reversion tracking
- 30-day rotation timeline
The Lens
Curated daily lists of high-conviction opportunities and scan quality analysis with full transparency on scoring methodology.
- Scan Quality Analytics
- Technical Breakdowns
- Quantum Regime highlights
Quantum Regime
Proprietary QRS technology identifies market regimes with quantum-inspired probability modeling.
- Regime change detection
- Conviction scoring
- Probability-weighted signals
Risk-First Architecture
Every signal comes with built-in risk metrics: stop levels, VaR, drawdown estimates, and position sizing.
- Dynamic stop loss levels
- Value at Risk %
- Position allotment suggestions
3D Framework
Tells if the individual stock's internal energy matches the sector's external direction, if the move is 'Real' or a 'Fake'?
- 1: "Environment" (Sector Regime)
- 2: "Location" (Z-Score & Momentum)
- 3: "Sync" (Cross-Entropy / Conviction)
Intelligence in Action
Analytics for professional traders, see the invisible flow of global capital.
Rotation Persistence
See exactly where sectors sit relative to the zero-baseline. Our model identifies the "Leading Edge" of the market as sectors transition into high-conviction momentum.
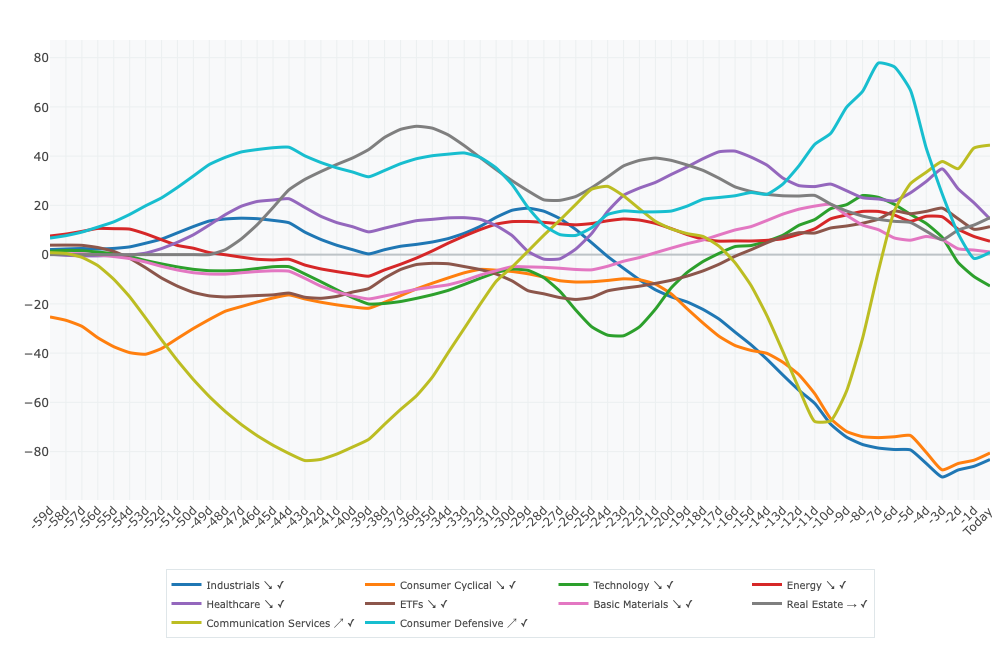
Relative Strength (RS)
Our Model effectively identifies the "leading edge" of the market by plotting sectors reletive strengths against a zero-baseline.
Know When Strength Becomes Vulnerability
Our Z-score analysis tracks deviation from historical means, helping you avoid buying at peaks and identify mean reversion opportunities before they trigger.
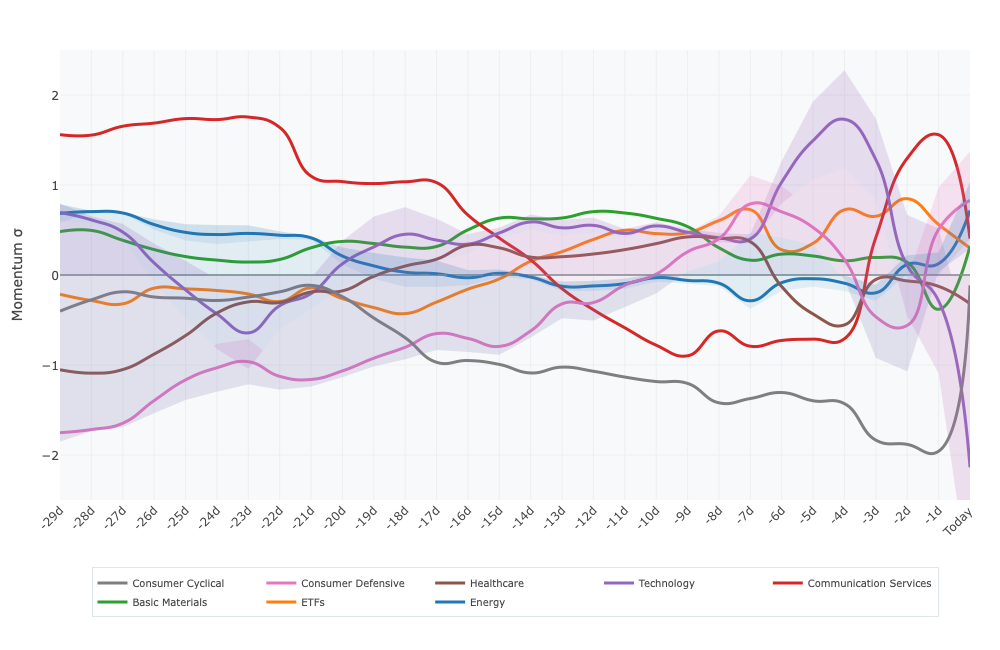
The Exhaustion Signal
Track the confidence bands of every sector. When momentum curves "hook" at extreme Z-scores, our system flags an immediate reduction in conviction.
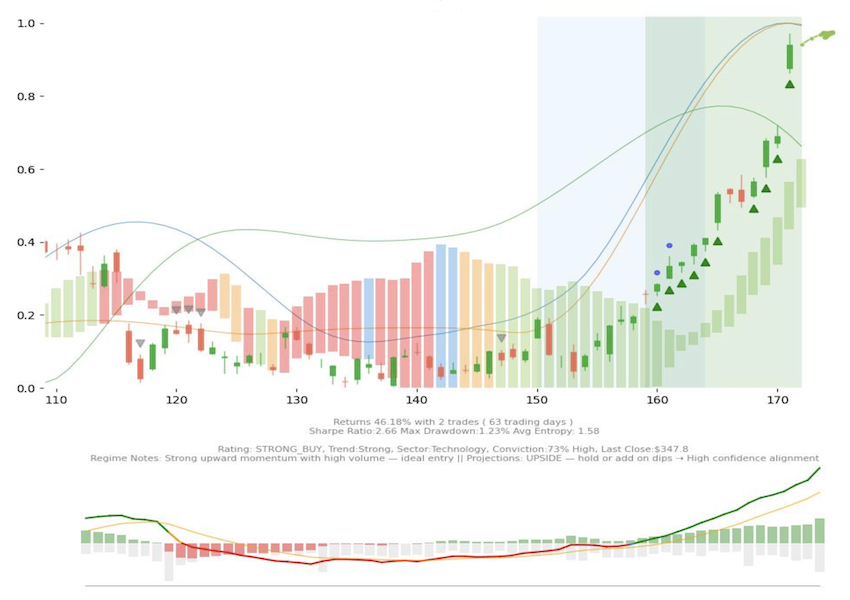
Adaptive Probabilistic Analyzer
Novel Quantum + Sector + DeepTunnel Regime Analyzer creates awareness results no traditional indicators can provide.
- Adaptive — The tunnel width Agregates Regime Confidences
- Probabilistic — Colors communicate Trend Probability
- Forward-Looking—Visuals — One glance tells you regime, momentum, and risk
The 3-Stage Methodology
A closed-loop system designed to find strength and predict exhaustion.
Multi-Vector Scan
The [X - Y] Persistence Score ensures strength isn't a one-day fluke. We track tickers and show multi-day institutional accumulation.
- Institutional Shakeout - Buy
- Exhaustion Risk - Trim
- Bear Market Relief - Sell
- Mean Reversion Target
Persistence Filter
Early detection system for sector rotation with inflow/outflow detection and mean reversion analysis.
- 🔸TICKER
- 🌤️ SECTOR ✓ 2.1
- 🔸/🌤️ ⇰ ✅
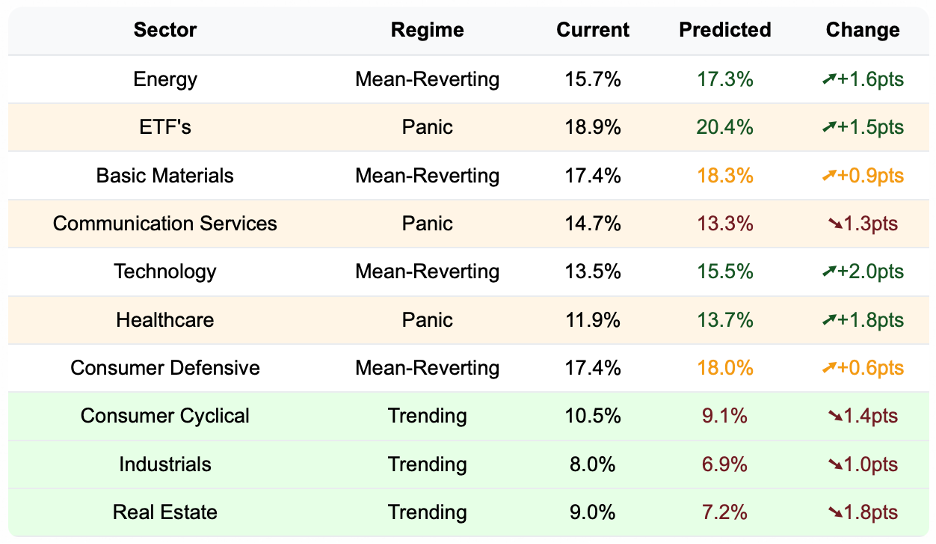
Regime Analysis
We predict the "Pivot." When a sector's Z-score indicates mathematical exhaustion with Hidden Patterns Discovering to identify current market character.
- Neutral
- Trending
- Mean-Reverting
- Panic